VocabularyVertical Axis: The up-down line on the left side of a graph. Has numbers that allow us to identify the graphs purpose
Horizontal Axis: The left-right line on the bottom of the graph. Has data/information that helps us identify the graphs purpose |

Today's Target: Be able to read a graph, and find out the mean, median, mode, range of the graph.
|
Reminder
- Mean: The averaged number of all numbers. Add all the numbers together then divide by the total amount of numbers used.
- Median: The middle number. Arrange the numbers in ascending, least to greatest, and the number in the center is the median. If two numbers are in the center, add them up and divide by 2.
- Mode: The number that appears most often.
- Range: The largest number minus the smallest number
Reading a Graph
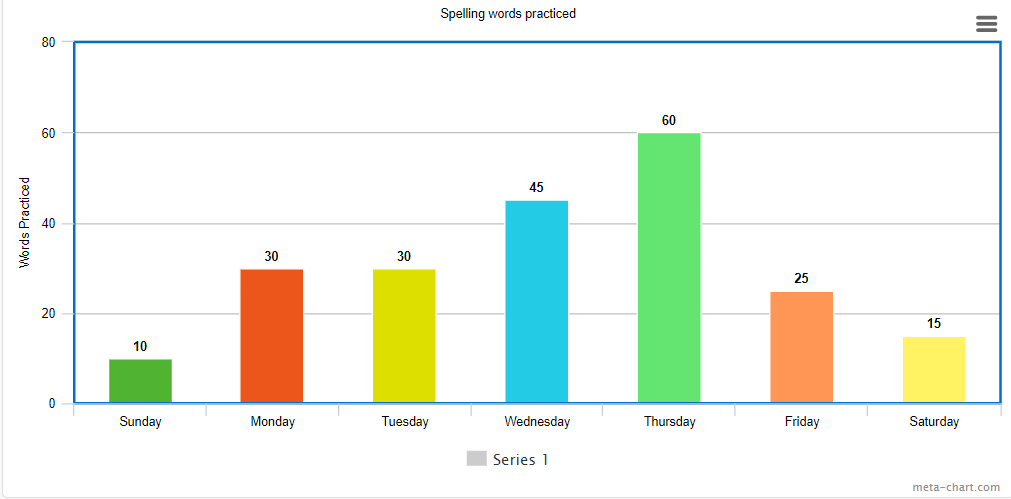
Below is a graph on "Spelling Words Practiced." Over the course of the week, students practiced the listed words. When reading a graph, we need to look at both the horizontal axis (the days of the week) and the vertical axis (words practiced)
|
Thursday: 60 words practiced
Friday: 25 words practiced Saturday: 15 words practiced |
What day did students study the most words?
What day did they study the least?
Based on the graph, what can you assume?
What is the Mode of this graph?
What is the Mean of this graph?
What is the Median of this graph?
What is the Range of this graph?
What day did they study the least?
Based on the graph, what can you assume?
What is the Mode of this graph?
What is the Mean of this graph?
What is the Median of this graph?
What is the Range of this graph?
Together - Pie Graph
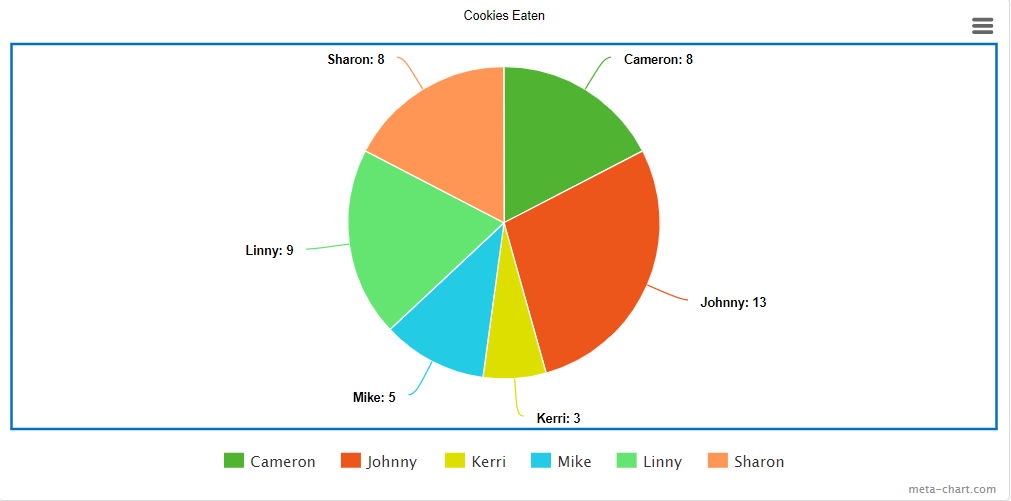
We will walk through this pie graph together.
Pie Graphs are unique because they always represent 100% of something. In the case below, it is 100% of cookies eaten.
Pie Graphs are unique because they always represent 100% of something. In the case below, it is 100% of cookies eaten.
How many cookies were eaten in total?
Based on the graph, what can you assume?
What is the Mode of this graph?
What is the Mean of this graph?
What is the Median of this graph?
What is the Range of this graph?
How many of the cookies were oatmeal?
Based on the graph, what can you assume?
What is the Mode of this graph?
What is the Mean of this graph?
What is the Median of this graph?
What is the Range of this graph?
How many of the cookies were oatmeal?
Practice
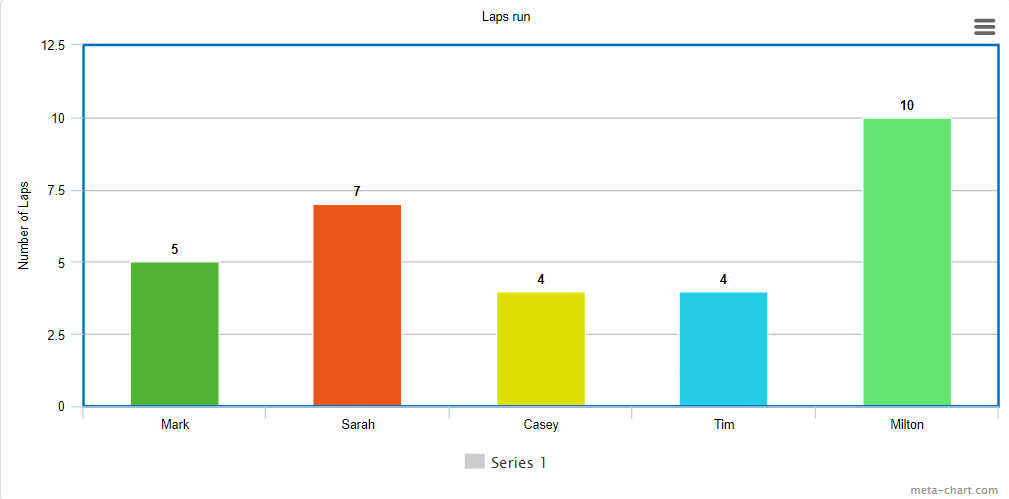
Below are 3 graphs. Use the provided information to answer the questions about each graph.
What is the Mode of this graph?
What is the Mean of this graph?
What is the Median of this graph?
What is the Range of this graph?
Based on the graph, what can you assume?
Where did the students run their laps?
What is the Mean of this graph?
What is the Median of this graph?
What is the Range of this graph?
Based on the graph, what can you assume?
Where did the students run their laps?
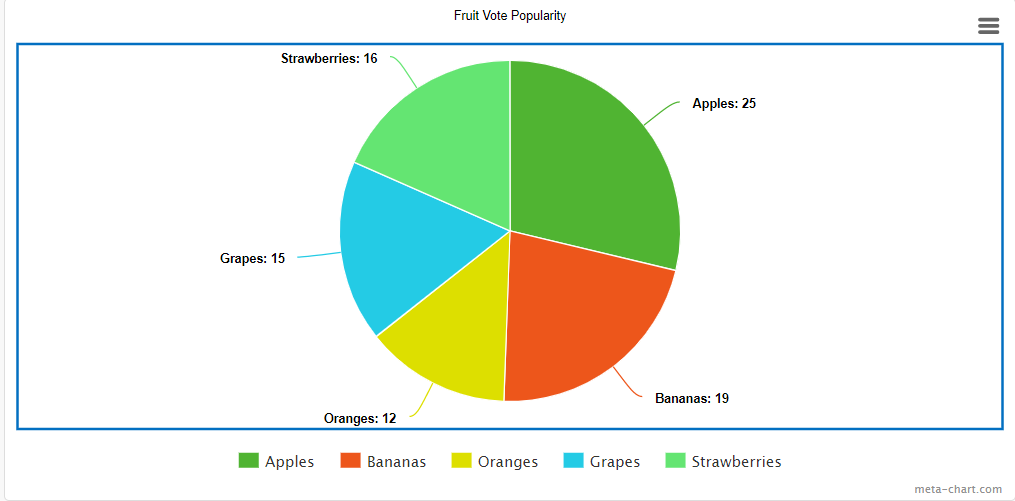
How many votes were made?
Which is more popular? Grapes + Oranges or Apples
What is the Mode of this graph?
What is the Mean of this graph?
What is the Median of this graph?
What is the Range of this graph?
Based on the graph, what can you assume?
Which is more popular? Grapes + Oranges or Apples
What is the Mode of this graph?
What is the Mean of this graph?
What is the Median of this graph?
What is the Range of this graph?
Based on the graph, what can you assume?
What is the Mode of this graph?
What is the Mean of this graph?
What is the Median of this graph?
What is the Range of this graph?
Based on the graph, what can you assume?
What is the Mean of this graph?
What is the Median of this graph?
What is the Range of this graph?
Based on the graph, what can you assume?
